When I first began fitting golf clubs, the range of equipment and adjustment options was far more limited than it is today. That did not make the results any less meaningful—it simply meant the right outcome could take a little more work to uncover. In 2026 Method Golf fittings use 14 data points to ensure accuracy in all fittings.
Every club has a specific job. The fitter’s role is to understand the player, identify what their equipment needs to achieve, and build a set of tools that supports their preferred ball flight while reducing the impact of their common misses.
The results below show examples of how a Method Golf fitting can improve performance, consistency and confidence through considered equipment choices and measurable change.

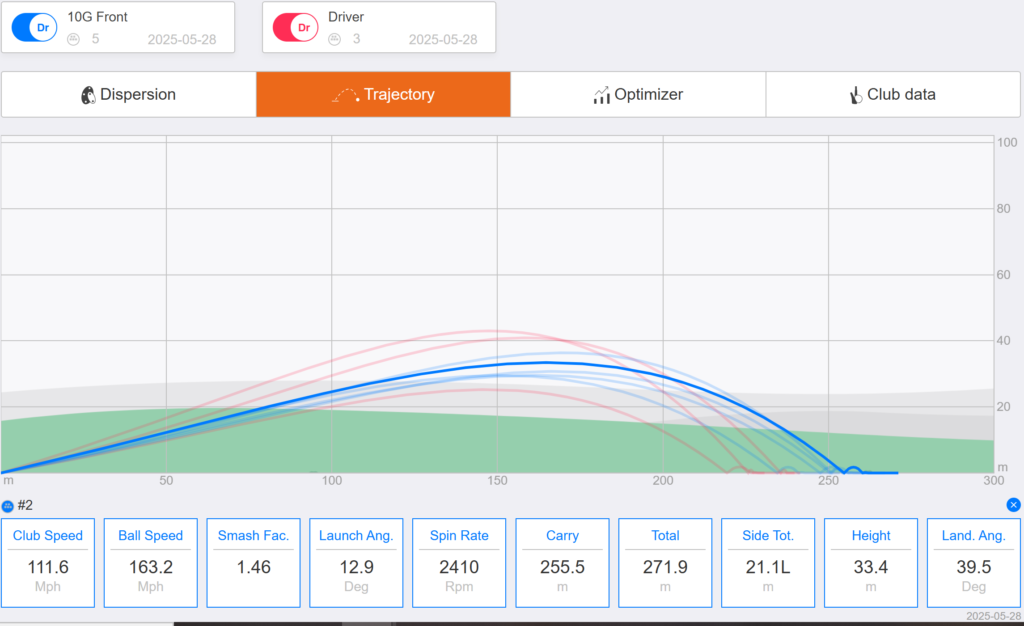
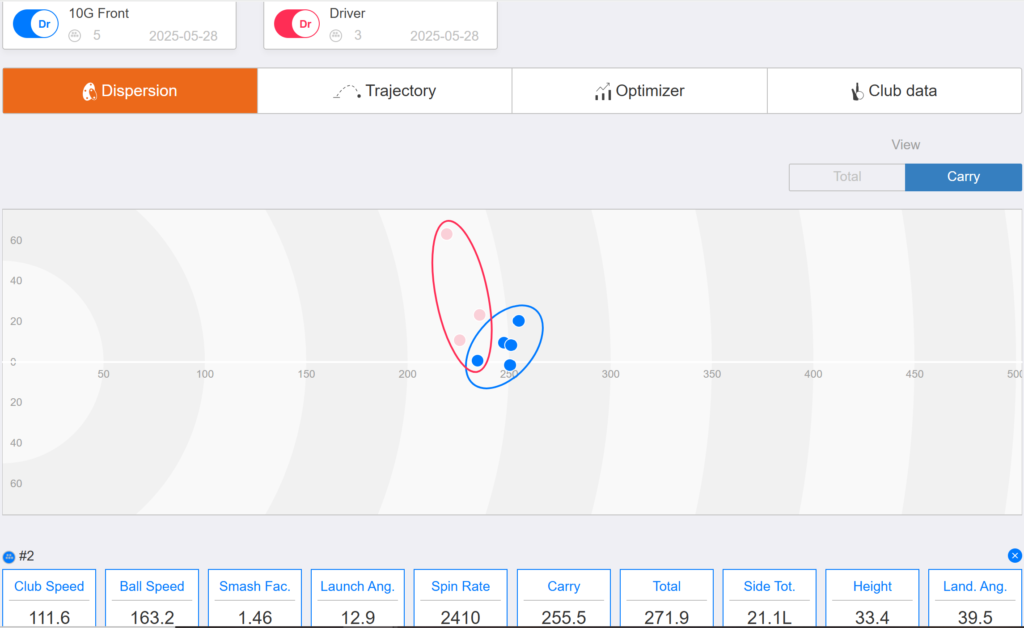
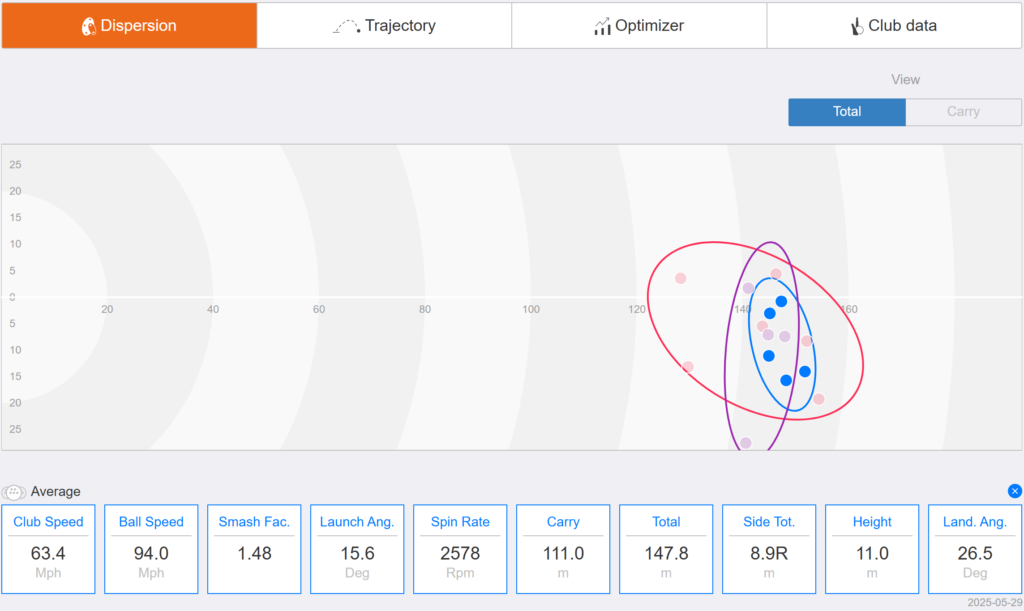
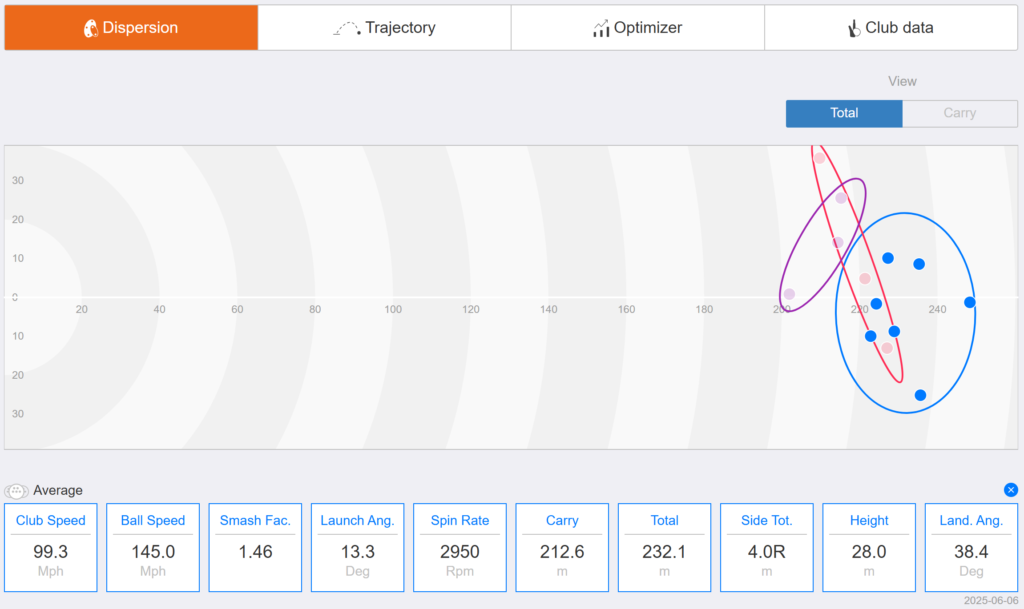
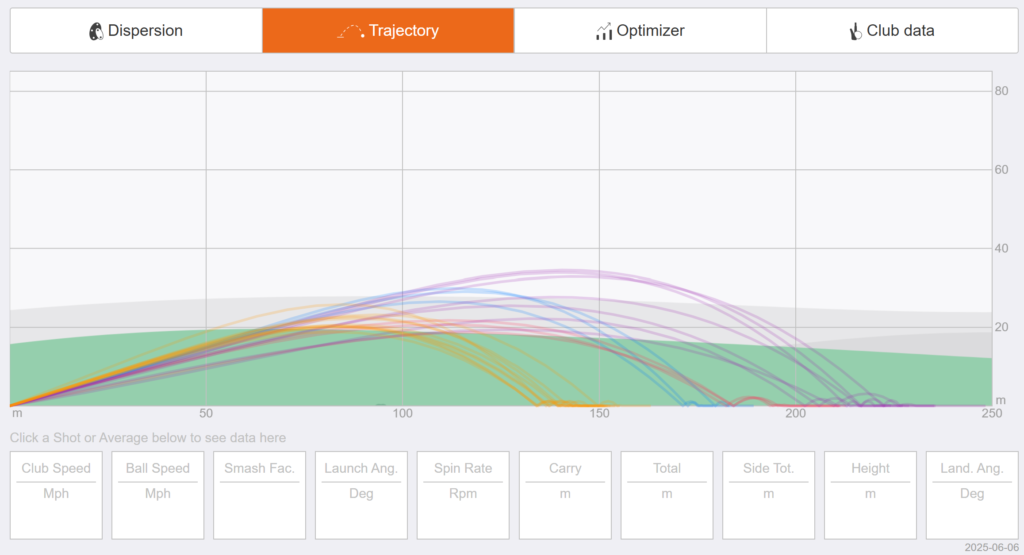
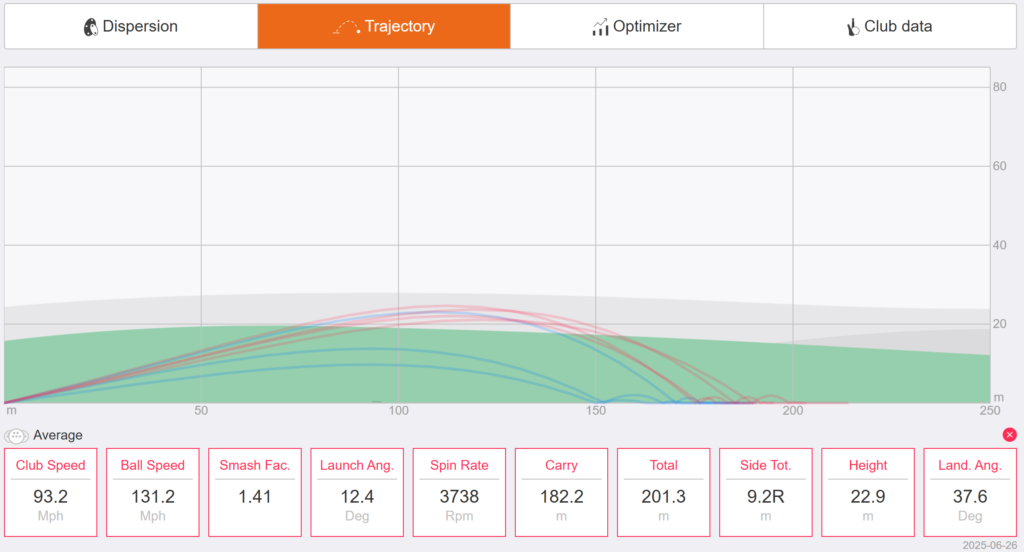
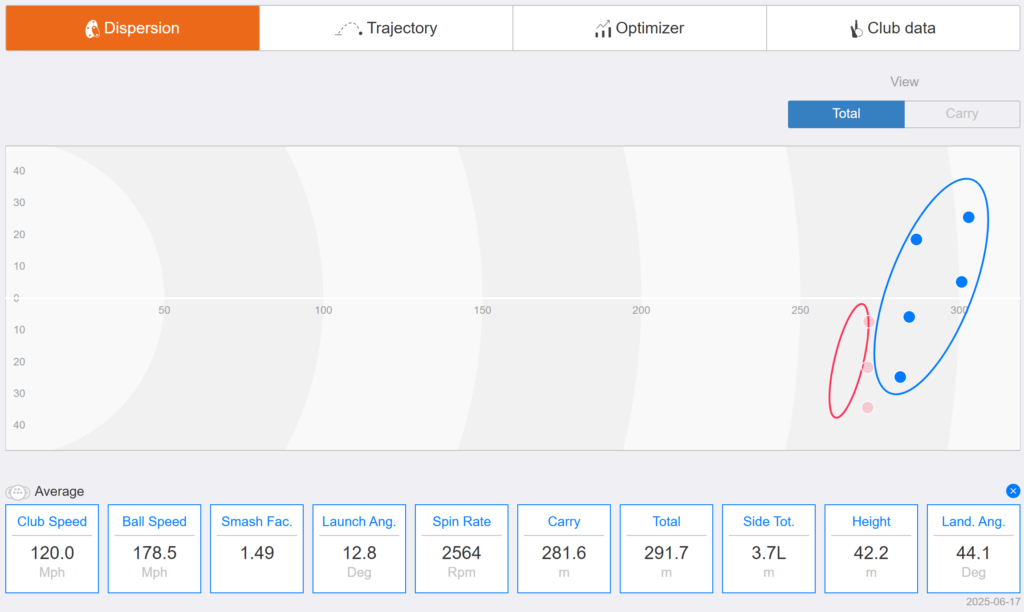
Improving the relationship between launch angle and spin rate, whilst considering ball speed, is a great way to optimise driver ball flight. A driver is designed to get the ball as far away from the player as possible, whilst staying in play…

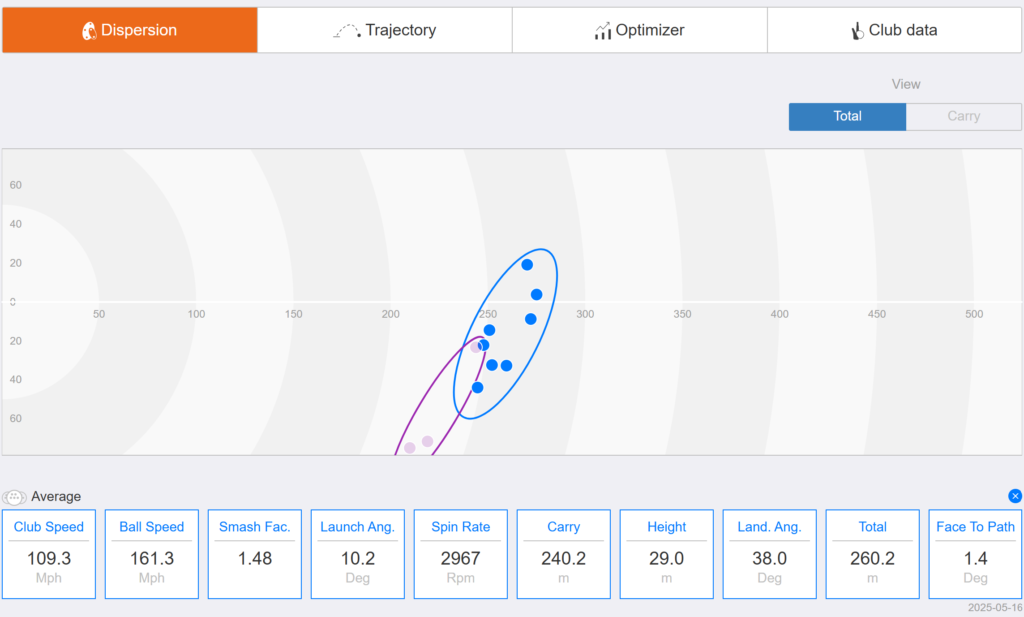
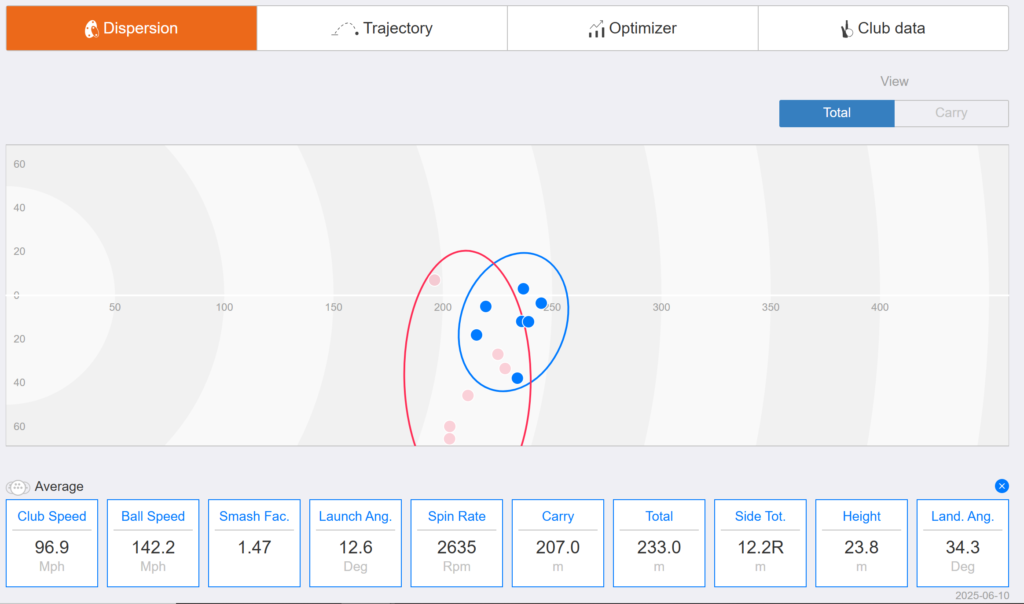
In the above 2 graphs, the blue data represents the newly fitted driver. We can see a tighter dispersion and the ball going further, a win-win which often happens when clubs are correctly fitted.

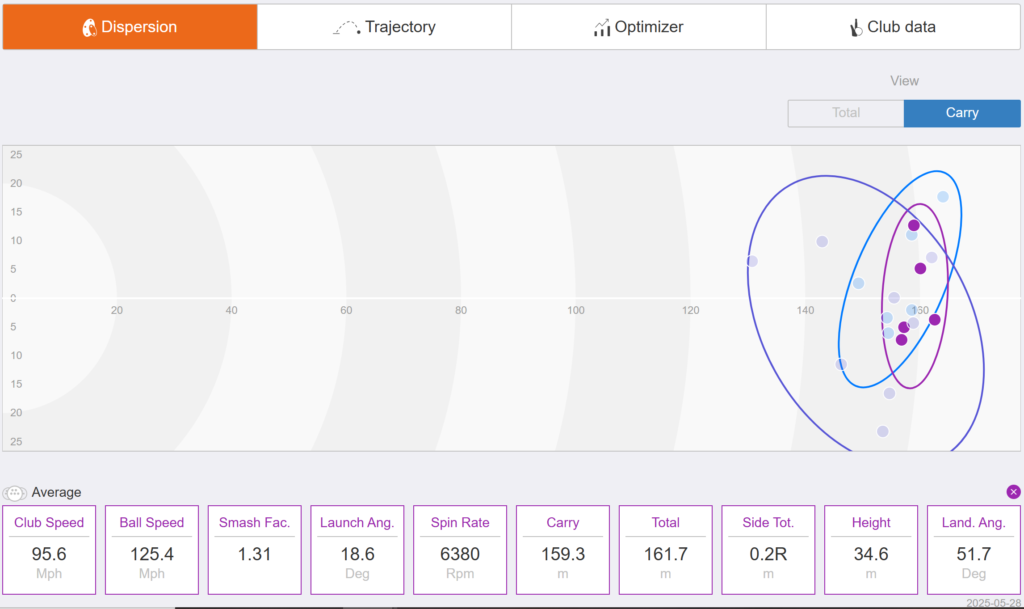
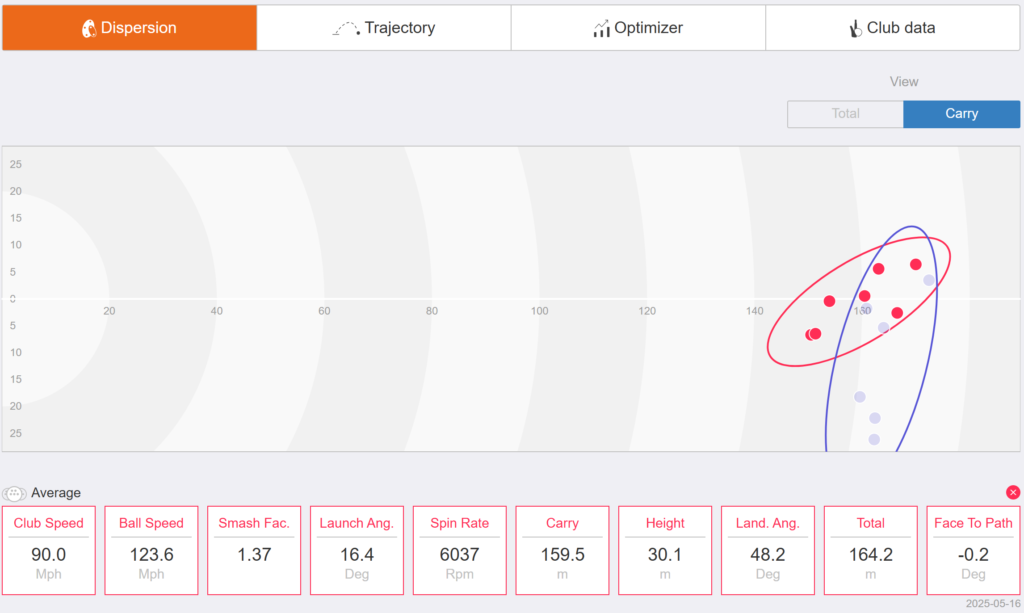
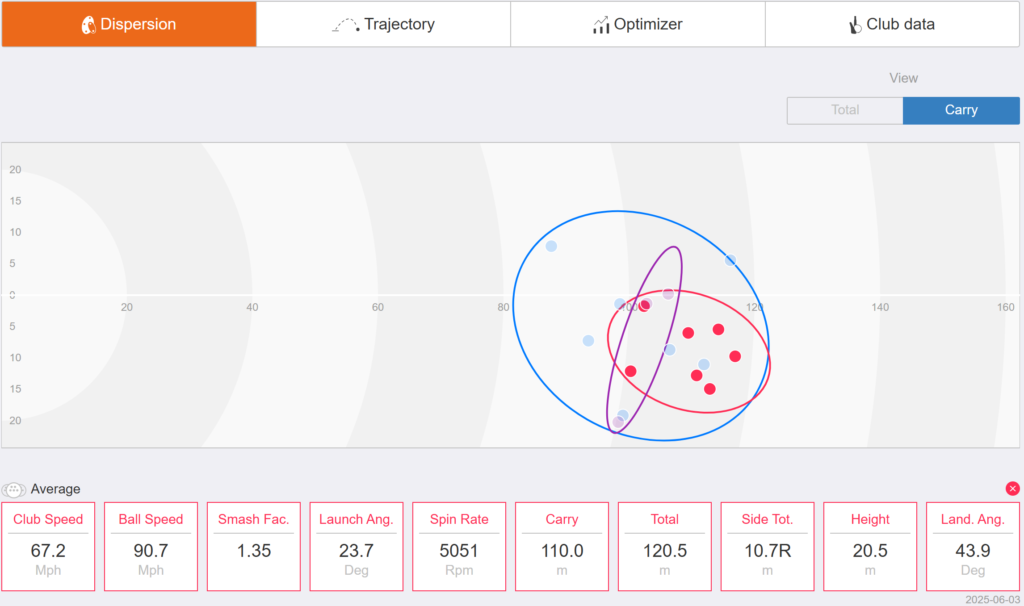
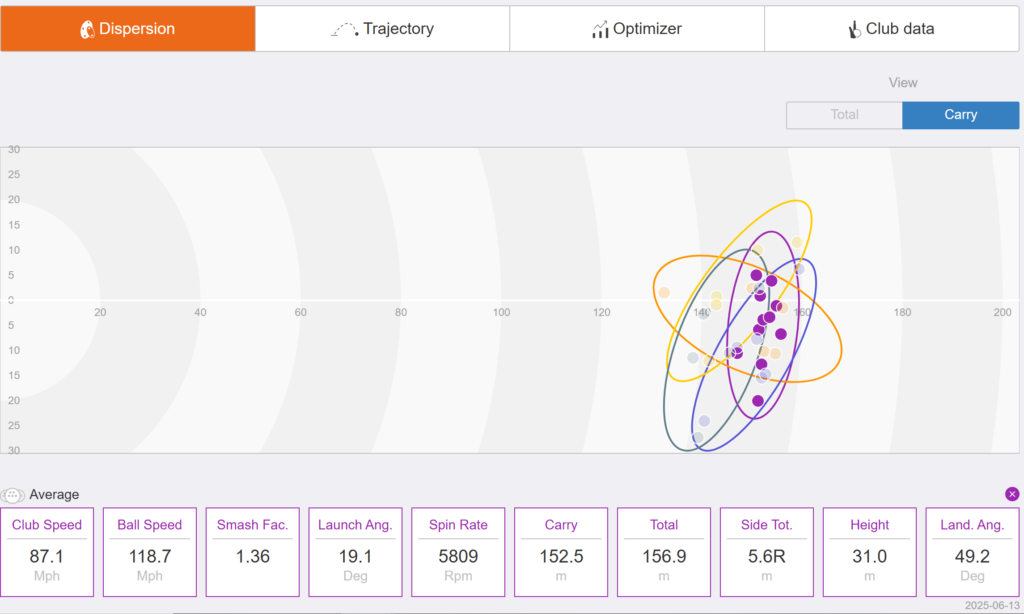
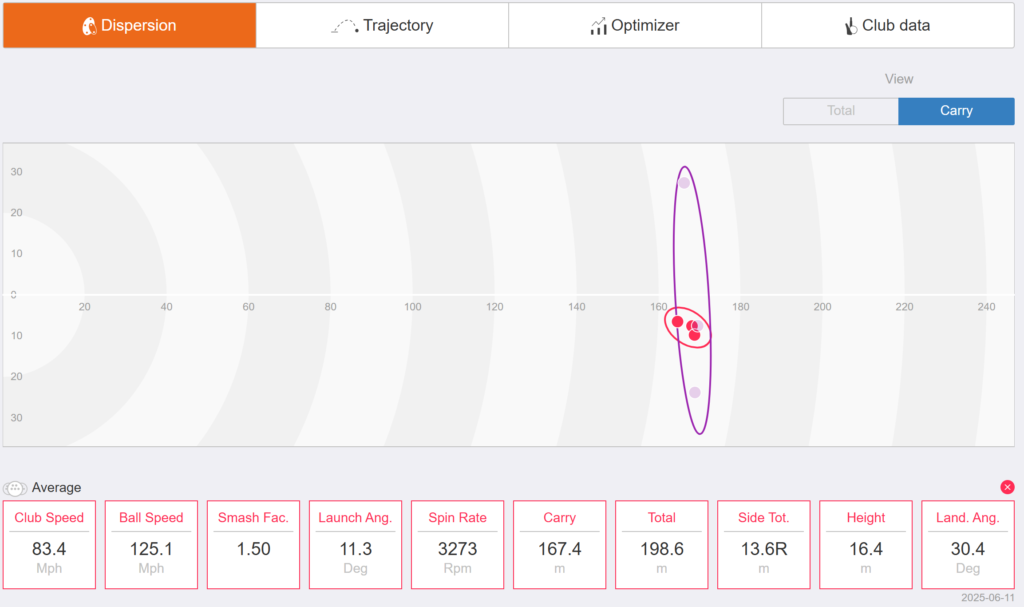
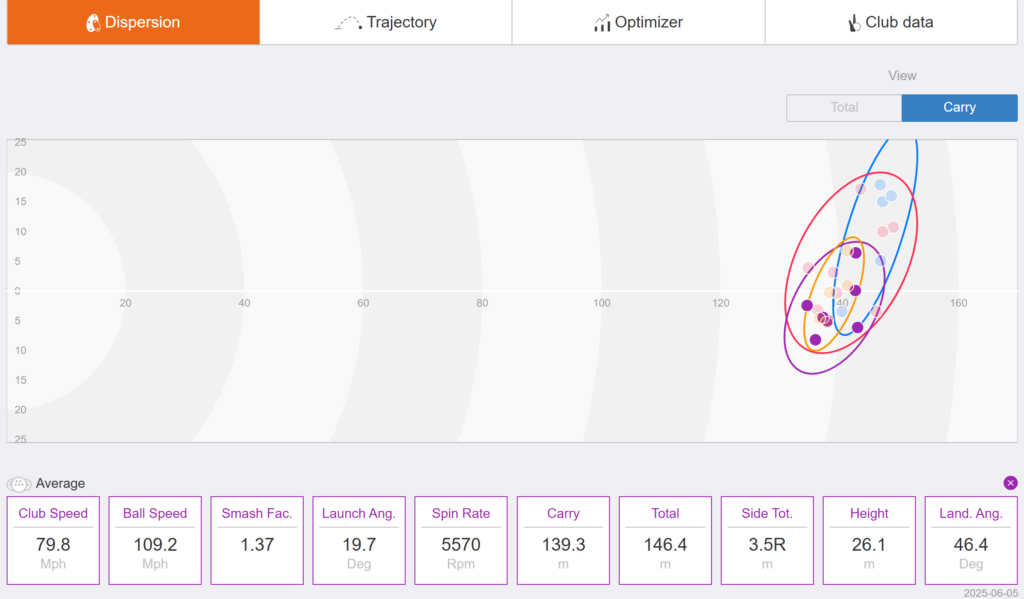
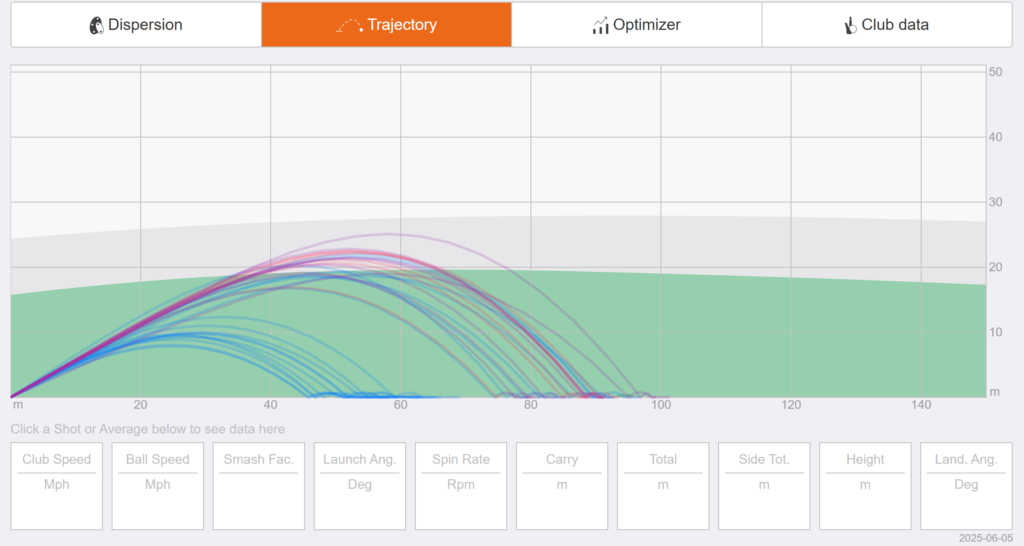
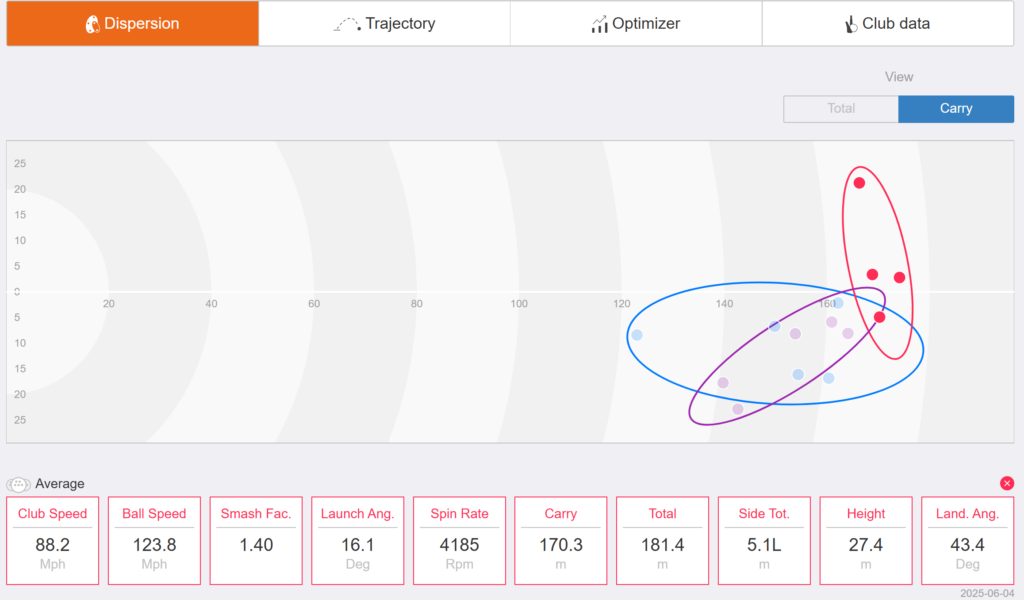
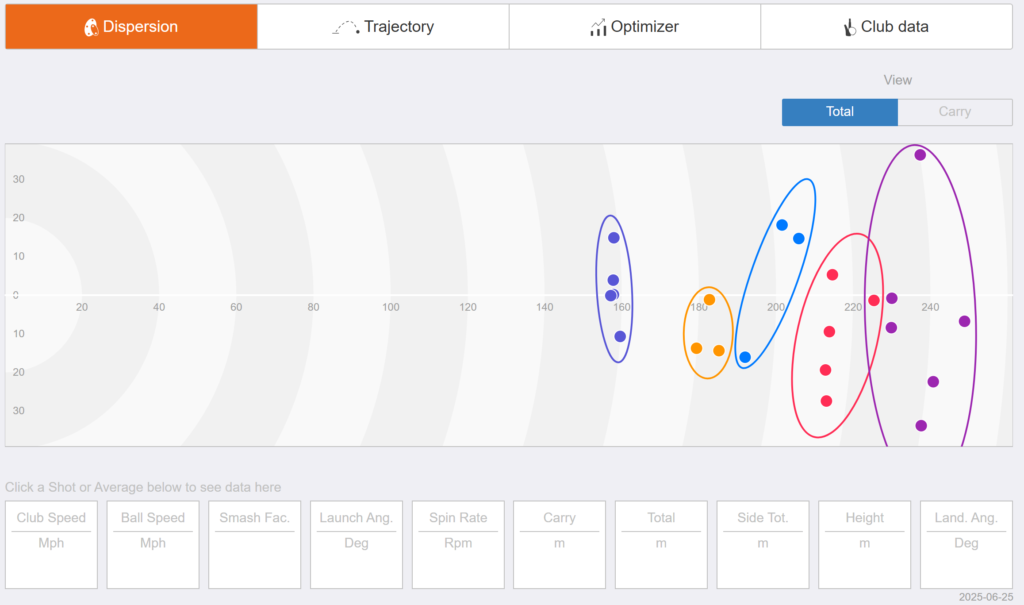
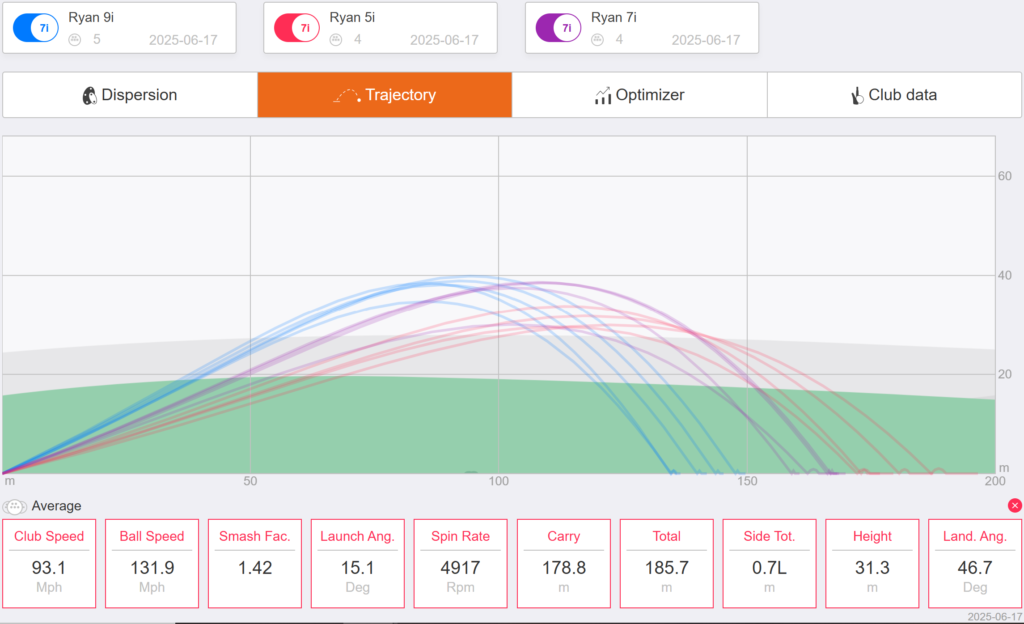
Irons are predominantly a set distance club, in this case the newly fitted club in purple data shows huge improvement in North/ South dispersion. This player now has a better chance at hitting the green and lowering their score.

Leaning into player tendencies with properly fitted clubs can give a more consistent result, irons are about dispersion control and stopping power – the above player has both and can now afford aggression with approach shots.

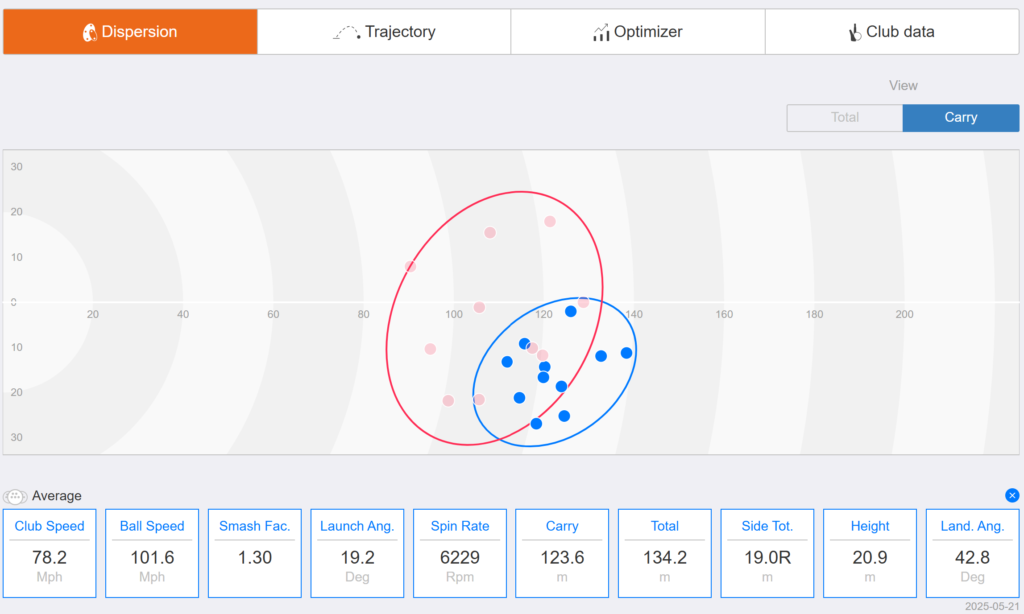
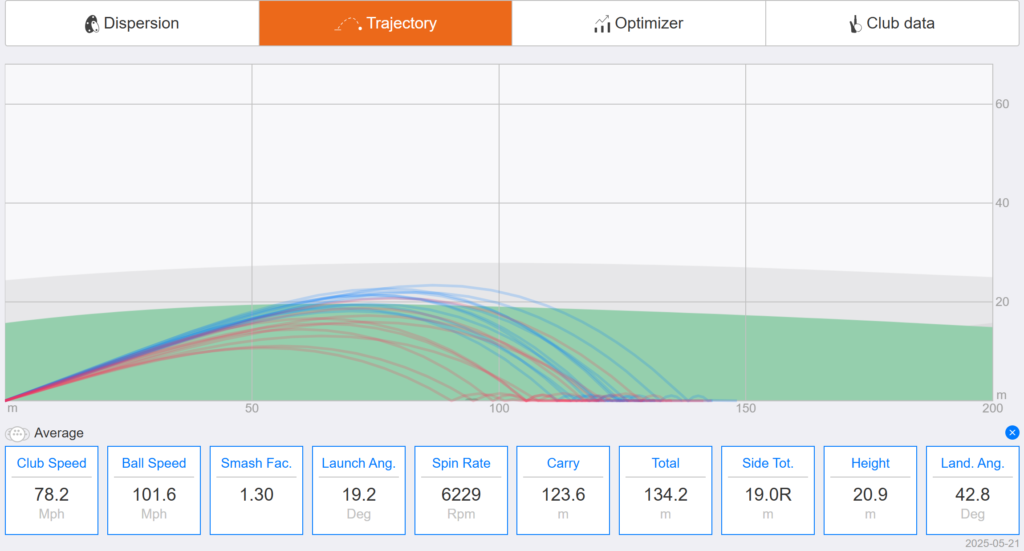
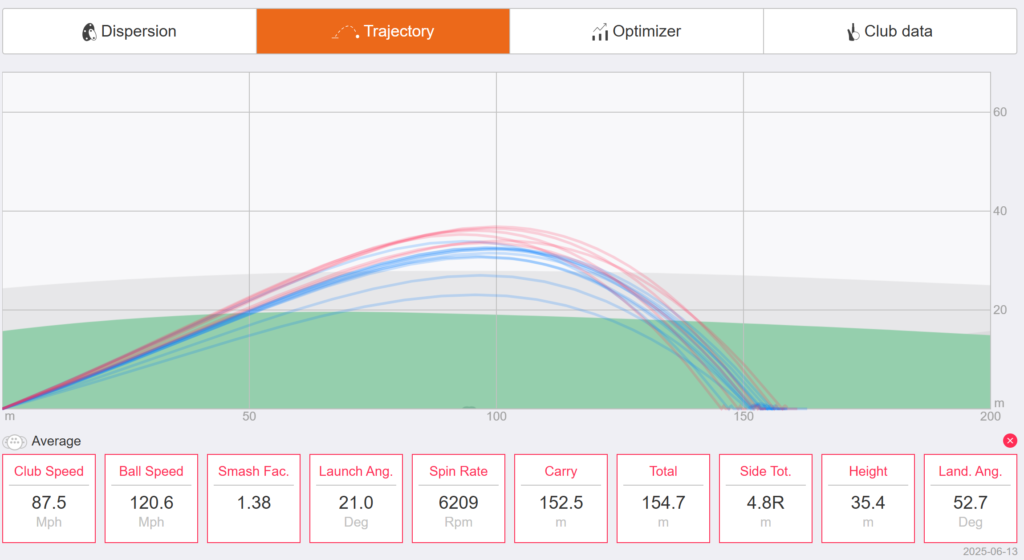
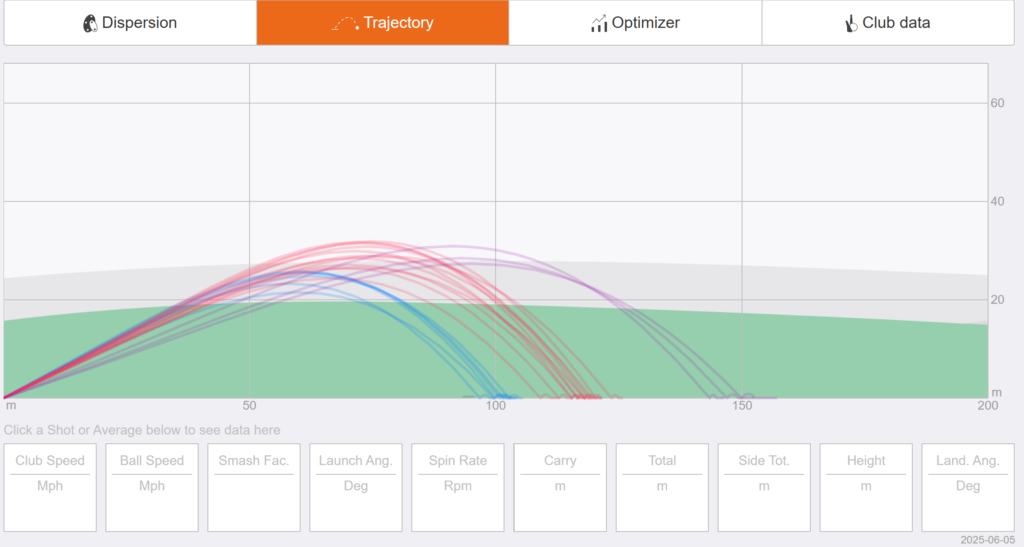
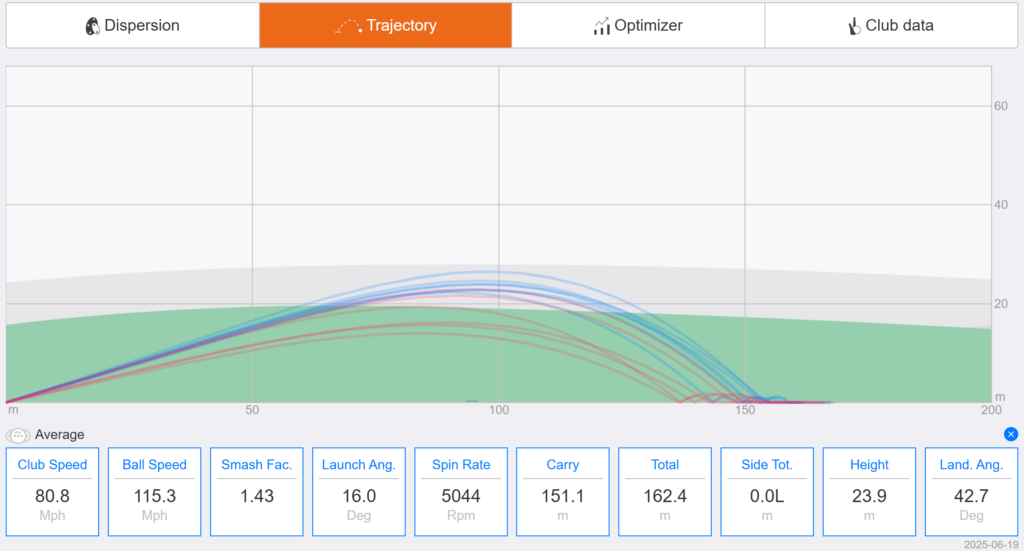
This player has gained height and distance, a relationship that often goes hand in hand. They’re now able to take ~2 clubs less into greens.

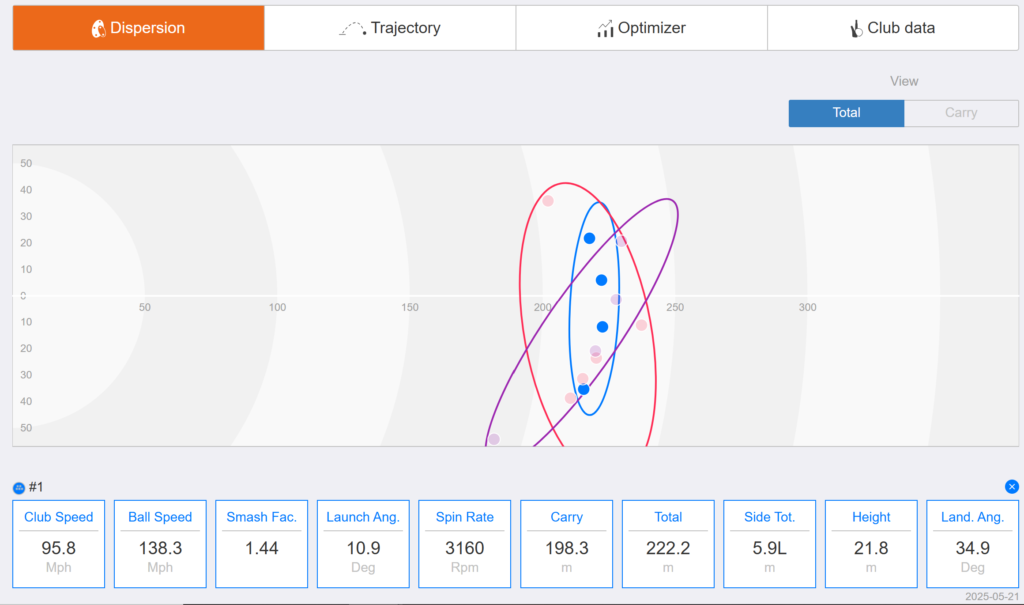
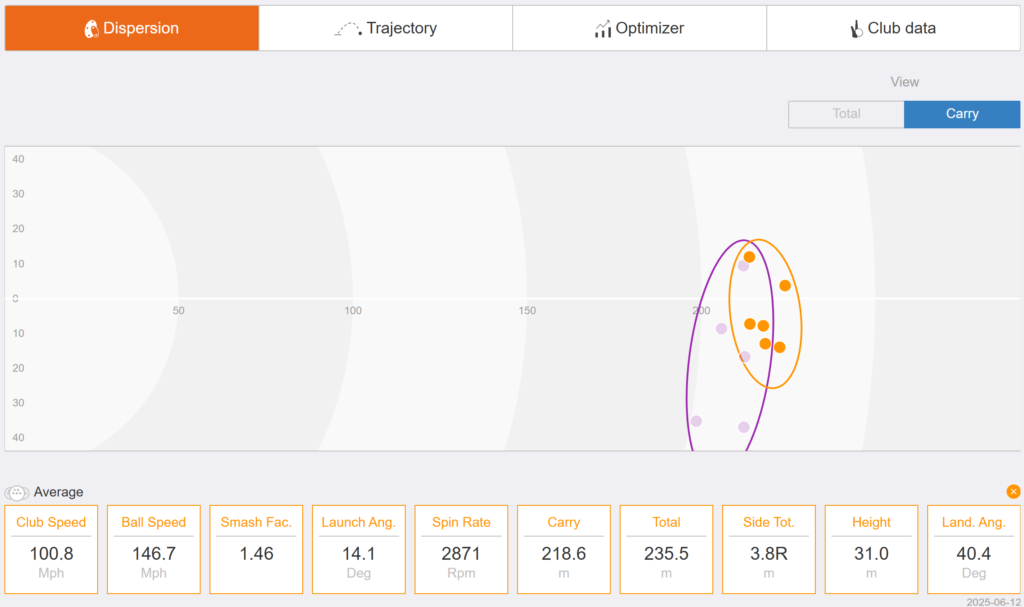
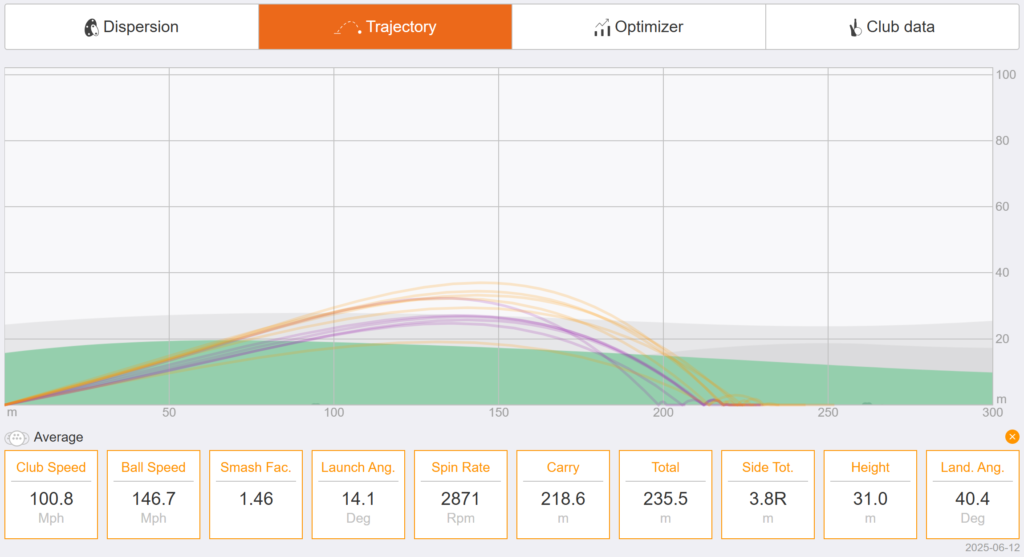
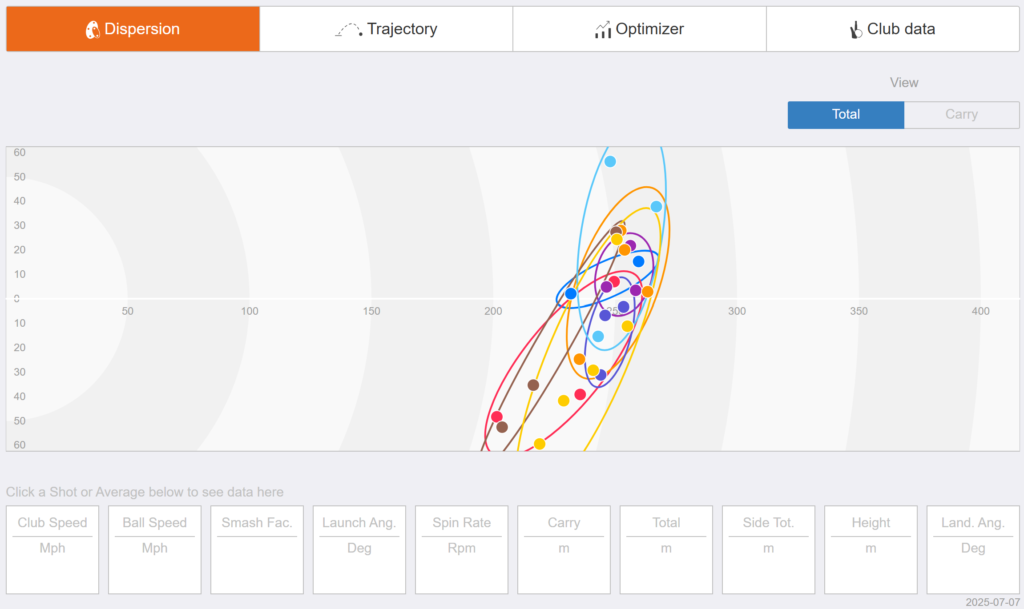
Typically the longer a club is the harder it is to control the face. In the blue above the difference is clear, and this player now has a reliable driver.

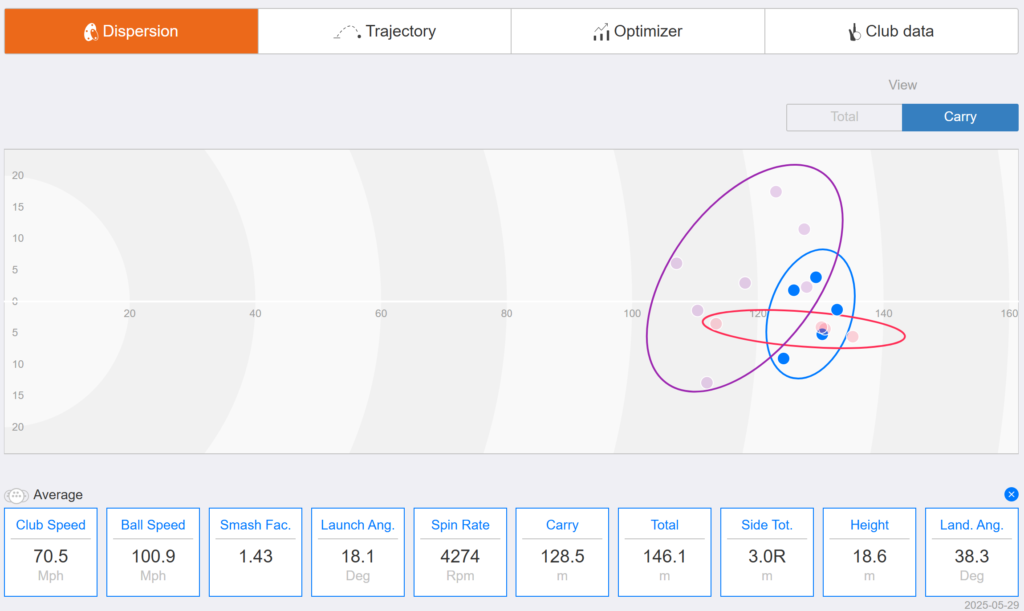
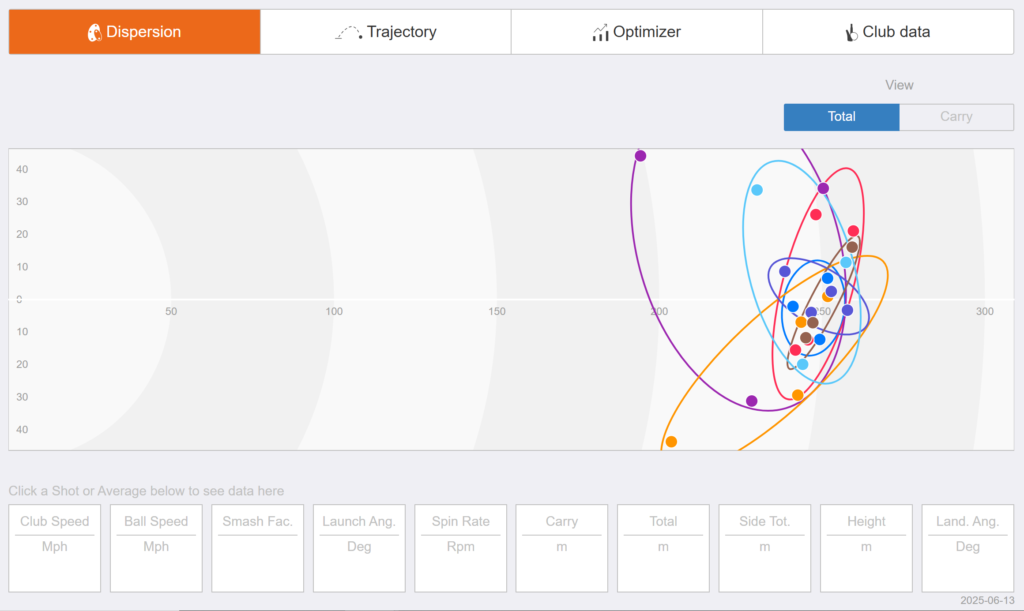
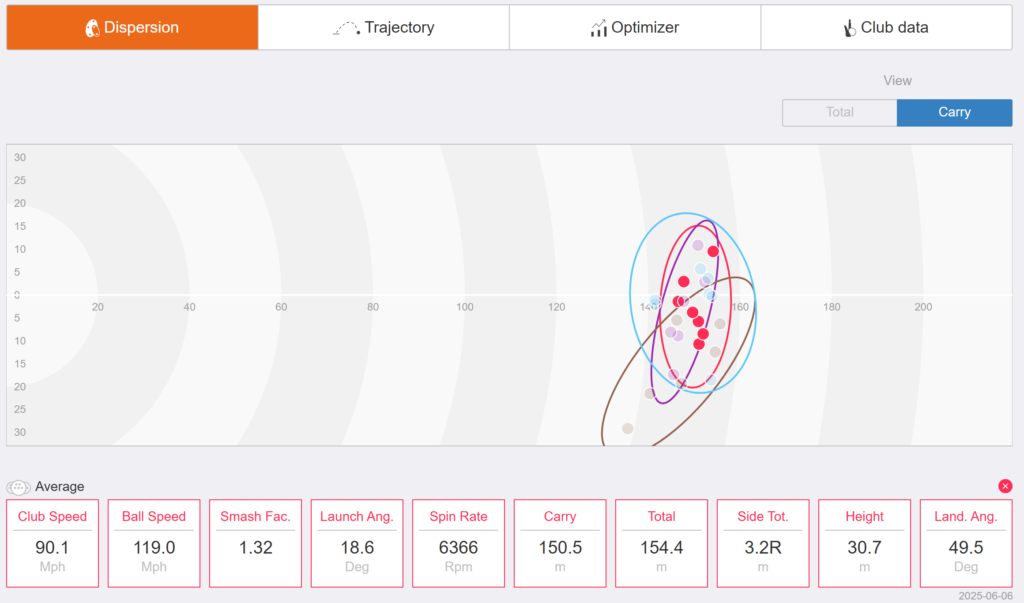
A small concession made in distance control to make a huge gain in lateral dispersion, golf is not a game of perfect but this player has considerably more trust in his target line.

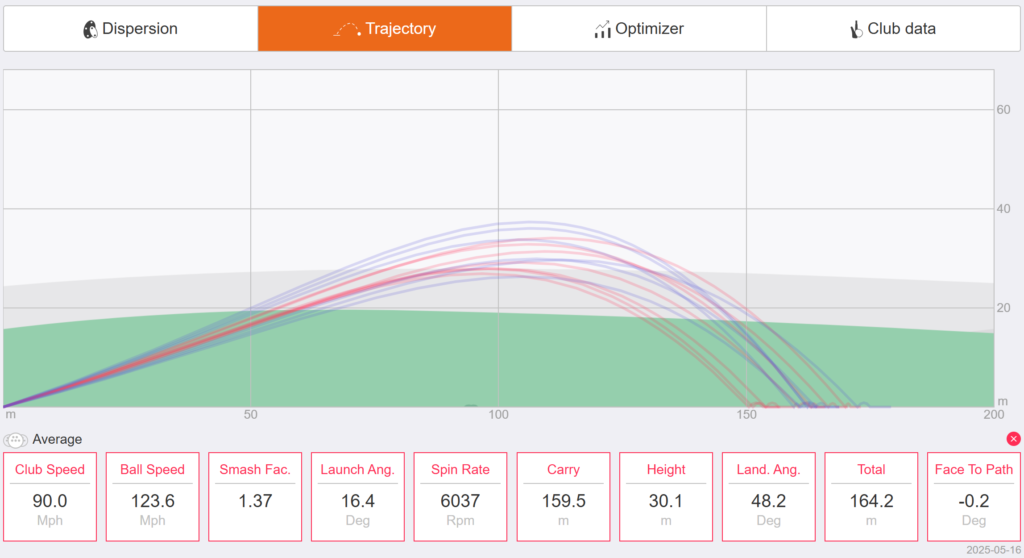
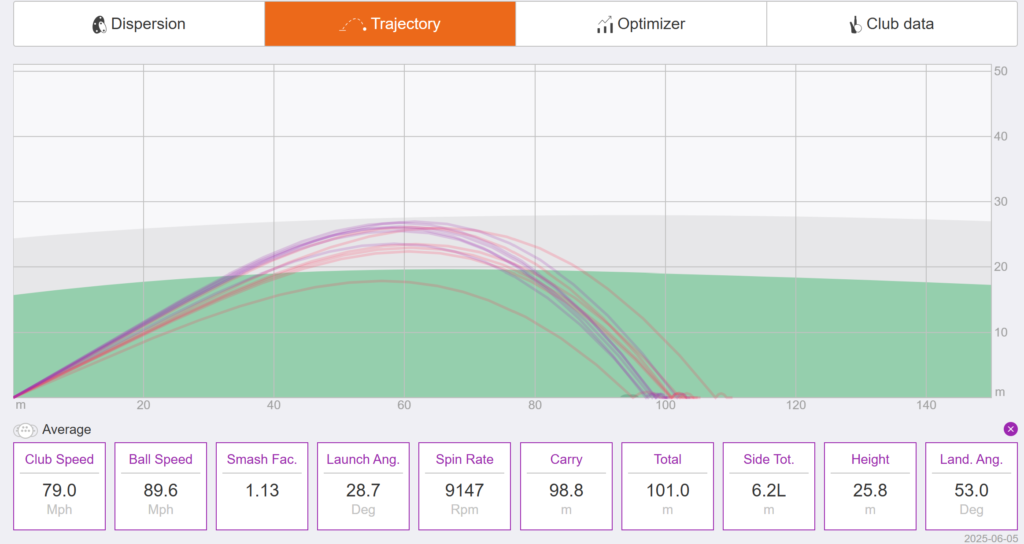
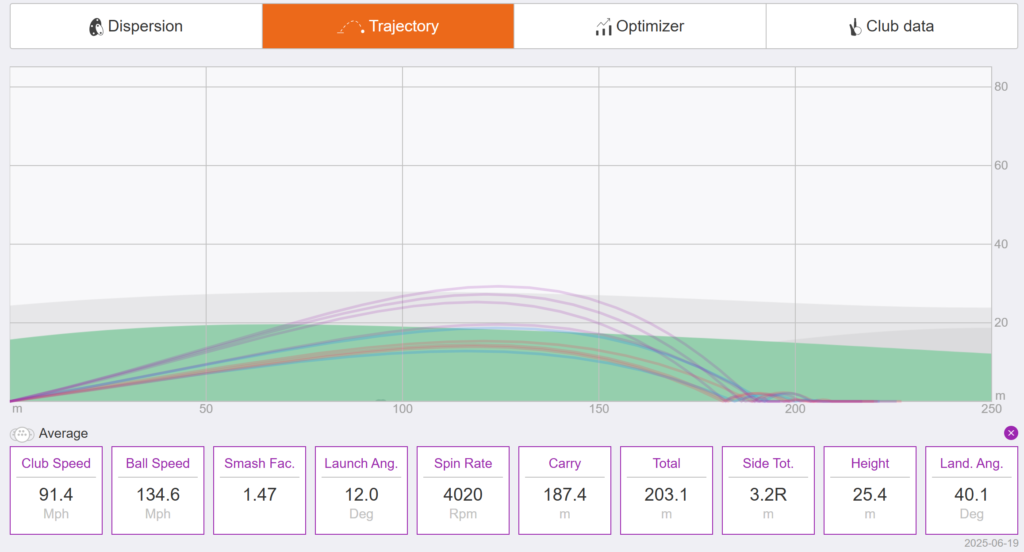
A higher than typical smash factor indicates central strike and low dynamic loft. The moderate spin-rate and high ball speed allowed the delivery to produce consistent stopping power whilst hugely improving consistency.

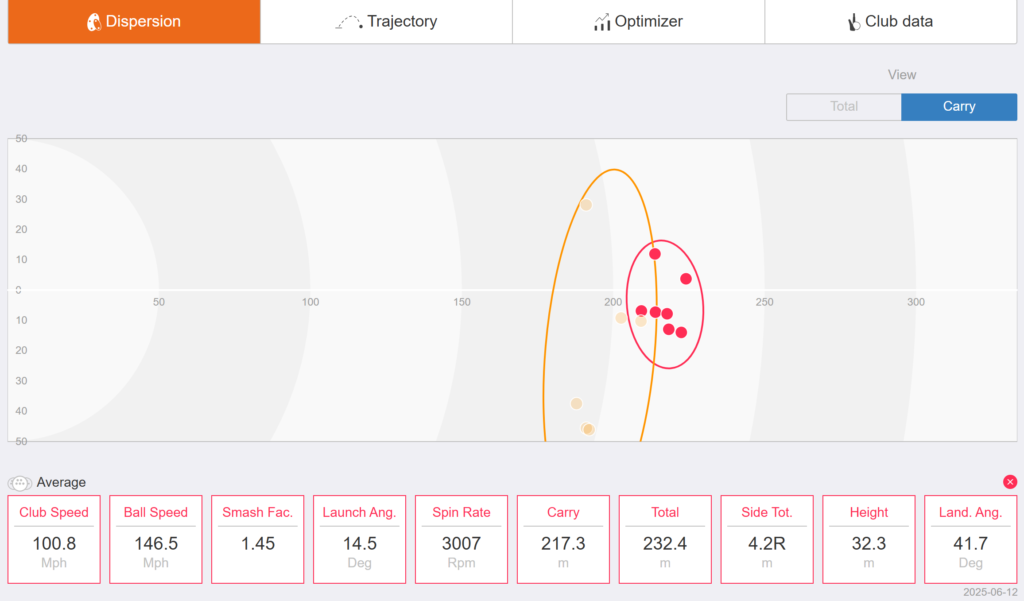
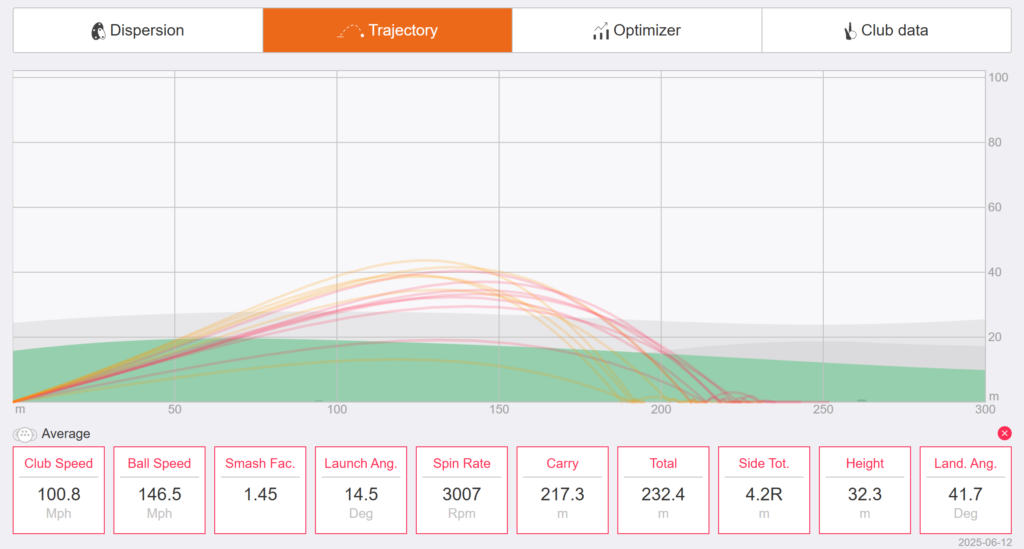
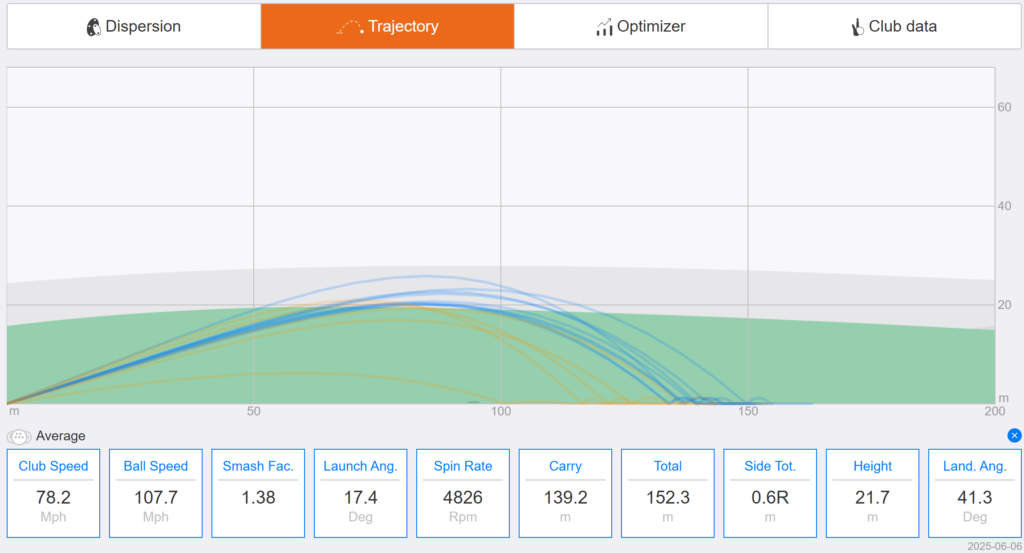
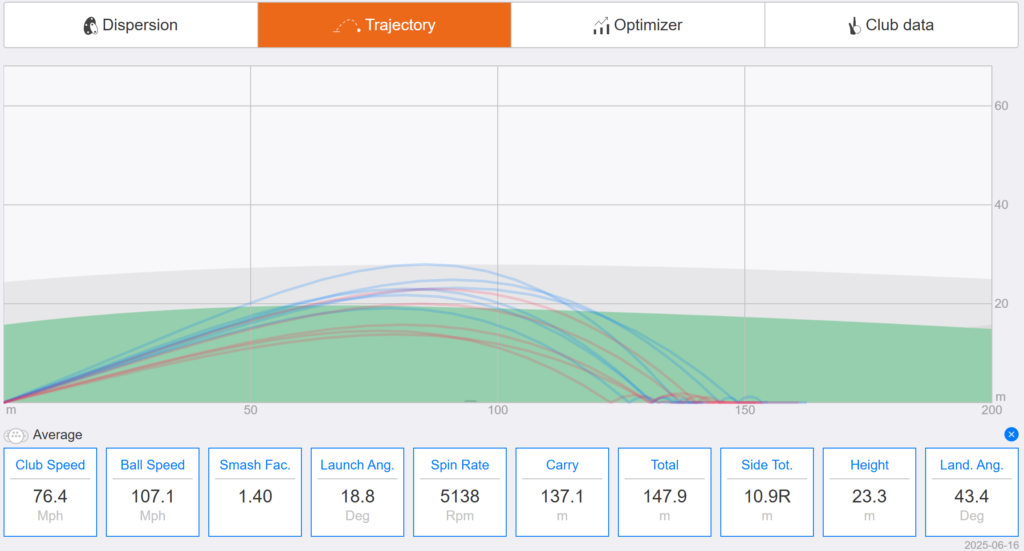
Slightly lower than average head speed creates challenges in distance, predominantly due to a lack of ball speed but spin has a lot to do with it! On this occasion the player and I achieved a fairly high launch angle with central strikes, as such they left with a more consistent product that maintained his length and improved his control and stopping power.

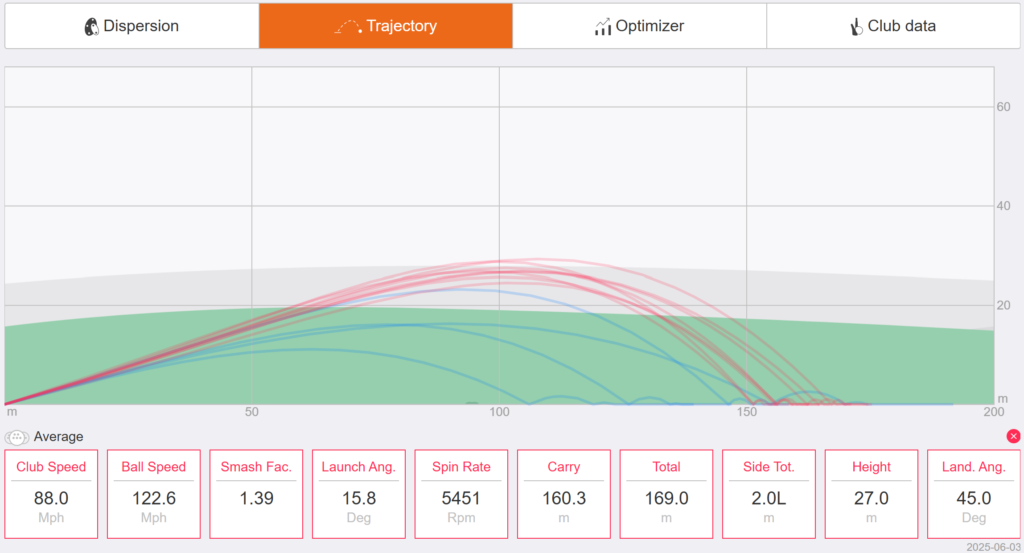
Another example of a slightly lower club head speed, however the challenge here was the lower dynamic loft and thus launch angle. Considering that the lower the dynamic loft the more influential face to path is on the balls direction, the player performed really well once provided a set-up which allowed club face control and central strikes. Although stopping power not hugely improved, this player got the best result out of his delivery.

Improving low point control and turf interaction meant this player was able to considerably improve distance deviation, as shown by the purple data.


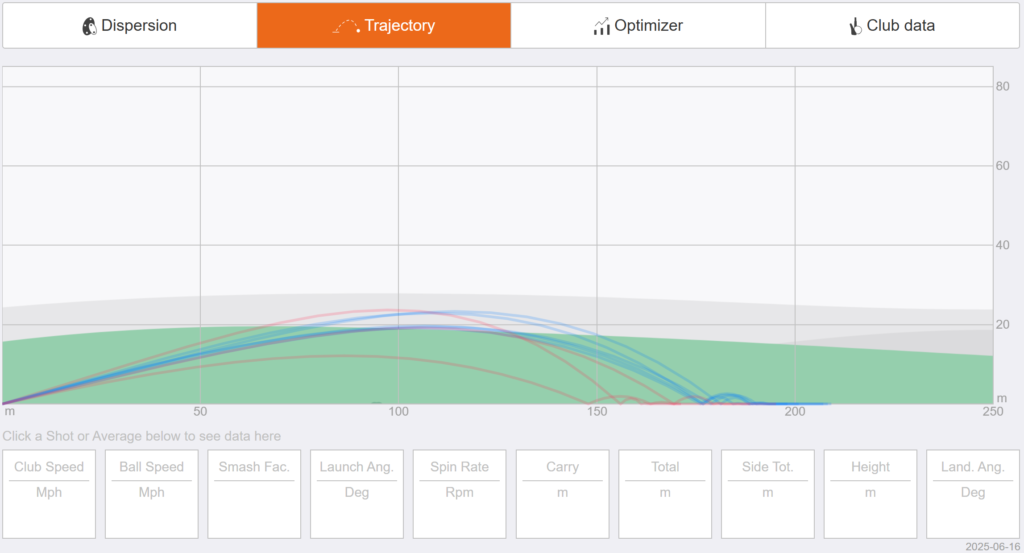
Although the descent is slightly steeper than what’s typically aimed for, it was a by-product of this player improving his launch allowing the difference between his best and worst drives to be lesser, whilst improving his average drive.


Another example of straighter and longer, not uncommon with driver fittings – particularly where the old product was grossly inappropriate as seen above.